Silver Price Crash 2026: From $120 to $90 in One Day — Is It Time to Buy or Run?
“Silver saw a rapid multi-day drop of around 25–30% after hitting peak levels… The next day, January 30, it dropped 31% in one session. That’s one of the worst single-day crashes in decades. Prices plunged from over $114 in futures to around $78 settlement, with spot hitting lows near $74. Billions in paper profits vanished overnight.
It felt apocalyptic. Many global investors — from Lahore to New York, Mumbai to Dubai — watched their gains evaporate and asked the same question: silver price crash 2026 — buy the dip or run for the hills?
I’m skeptical by nature. No hype. No conspiracy rants. Just facts, numbers, and a clear framework. Here’s the honest breakdown: what caused the silver crash January 2026, where prices stand in April 2026, and exactly when smart buyers step in — or stay away.
What Really Triggered the January 2026 Silver Price Crash?
The rally was insane. Silver started 2026 near $71, rocketed past $110, and touched $121.67. Then reality hit.
On January 30, the CME Group raised margin requirements on silver futures. Traders had to post more collateral fast. Many couldn’t — or wouldn’t. Forced liquidations kicked in like dominoes. Add the nomination of Kevin Warsh as Fed chair (which eased some rate-cut bets) and a stronger dollar. Boom — leveraged positions blew up.
Silver futures settled at $78.29 that day after a roughly $35–36 drop per ounce. It was the second-worst day on record, behind only the 1980 Hunt Brothers chaos.
This wasn’t just “profit taking.” It was classic paper market mechanics. High leverage met higher margins and triggered a silver liquidation 2026 wave. Physical buyers couldn’t absorb the speed. Spot prices followed the futures chaos.
Global investors felt it hard. In places like Pakistan or India, local premiums spiked on panic. Many who bought near the top got burned badly.
Here’s a simple comparison:
| Metric | Gold 2026 | Silver 2026 |
|---|---|---|
| Early 2026 Peak | ~$5,700/oz | ~$120/oz |
| Post-Crash Level | ~$4,700/oz | ~$88–92/oz |
| Volatility | Moderate | Very High |
| Industrial Demand | Low | Extremely High |
| Central Bank Buying | Massive | Minimal |
| Upside Potential | Moderate | High (if fundamentals hold) |
From $120+ to $90 (and Lower): How Brutal Was the One-Day Silver Wipeout?
Brutal doesn’t cover it. From the silver ATH 2026 of $121.67, prices crashed toward the $74–$78 zone in hours. Some reports called it a 30–33% single-day plunge in futures. Spot silver fell sharply too, though exact “from $120 to $90” framing captures the rapid multi-day unwind that followed.
By early February, prices stabilized somewhat around $80 before sliding further amid ongoing volatility. As of April 2026, silver trades around $75–$76 per ounce — still down roughly 38% from the January peak.
That’s a massive XAG/USD crash. Paper silver (futures and ETFs) got hit hardest. Physical silver held better in some local markets, but premiums jumped. COMEX inventories dropped noticeably as some metal moved or fears grew.
The wipeout hurt because many rode the 2025–early 2026 rocket (+140%+ gains). Then came the margin pain. It reminded old-timers of 2011, when silver also crashed after a parabolic run.
Why This Silver Crash Felt Different — And Why It Still Hurts Global Investors
Past crashes were big. This one felt different because of the speed and the paper-to-physical gap. The ratio is often cited around 300–350:1 — tons of paper contracts for every physical ounce.
Global investors outside the US faced extra pain. Currency swings (stronger dollar hurt many), higher local physical silver premium global, storage worries, and taxes all added up. In Asia and the Middle East, delivery delays or premium spikes made the crash sting more.
Yet the fundamentals didn’t vanish. The market entered its sixth straight year of silver supply deficit in 2026. The Silver Institute projects a 67 million ounce shortfall. Mine supply grows slowly (about 820 million ounces expected), while demand stays strong.
So the crash cleaned out weak hands. But did it break the bull case? Not entirely.
Silver Price Today April 2026: Technical Reality Check and Key Levels
As of mid-April 2026, silver hovers near $75–$76 per ounce. It has bounced a bit from lower $70s but remains well below the January peak.
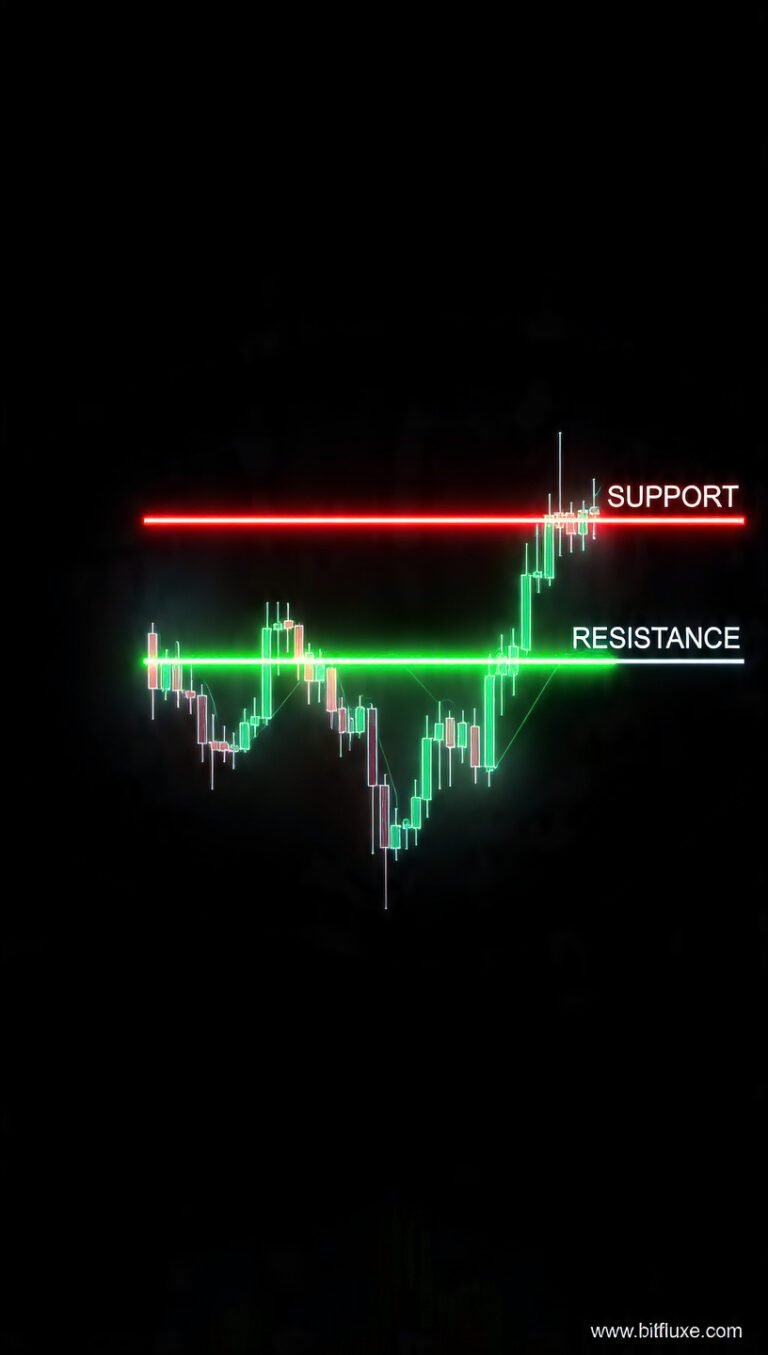
Technically, support sits around $70–$72. Resistance? $80–$85 zone looks key. Volume has calmed since the crash, but volatility stays high.
If it breaks below $70 convincingly, bears could push toward $60 or lower. Hold above $75–$76 and bulls regain some hope. Watch the gold silver ratio 2026 — currently around 63:1. When it expands (silver underperforms gold), it often signals caution.
Bull vs Bear Silver Forecast 2026: JPM $81 Average or $50 Warning — Who Wins?
Analysts disagree sharply on silver forecast 2026.
JPMorgan sees an average of $81 for the year — still double the 2025 average but far below the January peak. They point to tight supply and demand.
Bank of America and others have bull cases up to $135–$309 in extreme scenarios if the gold-silver ratio compresses hard. Citi also leans constructive on industrial needs.
On the bear side, former JPM strategist Marko Kolanovic warns silver “should be trading at half its price” later in 2026 — potentially back toward $50 if speculative mania unwinds fully.
My skeptic take: The truth likely sits in the middle. Fundamentals support higher prices long-term. Short-term? Volatility rules. Don’t bet the farm on any single forecast.
Understand the Unbreakable 6th Straight Year of Silver Supply Deficit
Here’s the core proof many bulls hang on.
The Silver Institute forecasts the silver market deficit at 67 million ounces in 2026 — the sixth consecutive year. Total supply reaches about 1.05 billion ounces (mine production + recycling), but demand exceeds it.
Industrial use (solar panels, EVs, electronics, AI-related) eats a huge chunk — around 650 million ounces expected, even with some thrifting. Investment demand stays resilient too.
This isn’t new. Cumulative deficits over recent years top hundreds of millions of ounces. Above-ground stocks help fill gaps, but they aren’t infinite.
Industrial Silver Demand Boom (Solar, EVs, AI) vs Paper Liquidation — The Real Battle
Industrial demand is the silent hero. Solar alone consumes massive silver. EVs and 5G/AI infrastructure add more.
Yet in 2026 forecasts, industrial offtake may dip slightly (2%) due to higher prices causing some substitution or efficiency gains. Still, overall demand holds.
The battle is paper vs physical. The COMEX silver inventory has tightened in recent years. Liquidations in the crash showed how fast paper can unwind. When physical buyers step up (especially in Asia), the gap becomes visible.
That’s why some see this silver crash January 2026 as a healthy flush — not the end.
Physical Silver vs COMEX Paper Market: Hidden Realities Global Buyers Must Know
Paper silver moves fast and wild. Physical silver? Slower, with real costs.
Global buyers face physical silver premium global — often 5–20%+ depending on location, form (coins, bars), and dealer. In Pakistan or India, premiums can spike during volatility. Storage, insurance, and taxes (VAT/GST in many countries) matter too.
COMEX delivers actual metal, but most contracts settle in cash. The 350:1 paper-to-physical talk highlights the leverage risk we saw in January.
Lesson: If you buy physical, do it for the long haul. Know your local premiums and secure storage. Don’t chase paper hype.
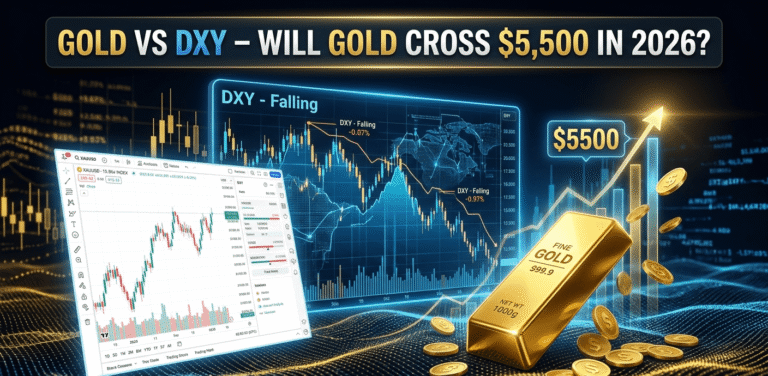
Gold Silver Ratio in 2026: Macro Risks That Could Crush or Rocket Prices
The ratio sits around 63:1 now. Historically, high ratios (80–100+) often precede silver outperformance. Low ratios favor gold relatively.
Macro risks abound: US tariffs, Fed policy under new leadership, geopolitics, and oil prices. A stronger dollar or recession fears can crush both metals short-term. Inflation or supply shocks can rocket them.
Watch these for your silver investment strategy 2026.
Historical Silver Crashes — Does the Metal Always Recover Stronger?
Yes — usually. After the 2011 peak and crash, silver eventually climbed again. The 1980 Hunt episode saw epic volatility followed by years of lower prices, but fundamentals differ now.
Past big drops (like 2008 or 2011) often marked good entry points for patient buyers — if you avoided leverage and timed the bottom roughly.
The silver recovery 2026 question depends on deficits and demand. History says rebounds happen, but timing hurts.
Don’t Buy the Silver Dip Yet — The Contrarian Checklist: When to Run Instead
Here’s the skeptic part many articles skip.
Run signals (or at least pause):
- Silver breaks below $70 and stays there with rising dollar strength.
- Gold-silver ratio explodes above 90:1.
- Major recession kills industrial demand.
- COMEX inventories rebuild massively while deficits shrink.
- Your personal finances can’t handle another 30% drop.
If none of these scream “danger,” the dip may deserve a look. But never all-in. Size small.
Is silver a good investment now? Only if it fits your risk tolerance and time horizon.
Your Global Silver Action Plan 2026: Exact Steps to Buy Smart or Stay Safe
- Check fundamentals first — Confirm the deficit story still holds via Silver Institute updates.
- Decide physical vs paper — Physical for long-term holding (coins/bars from reputable dealers). Paper/ETFs for trading (but watch leverage).
- Shop local premiums — Compare in your country. In Pakistan, check trusted Lahore or national dealers. Factor currency hedging.
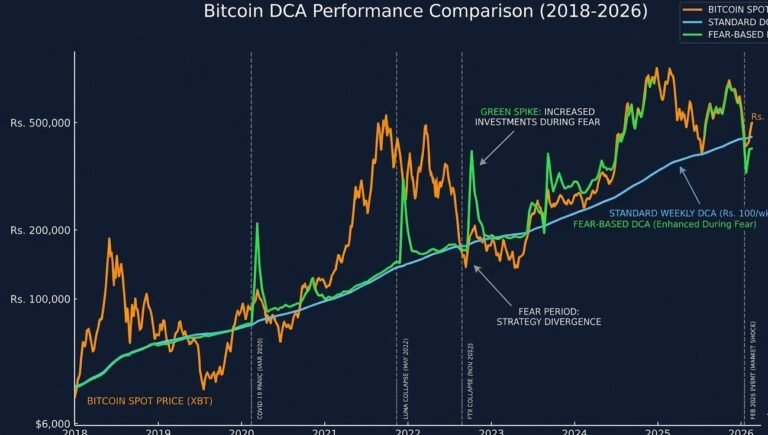
- Dollar-cost average (DCA) — Buy small amounts on dips rather than lump sum.
- Set rules — Example: Buy more below $72 if ratio >80. Sell or trim above $100 if macro worsens.
- Secure storage — Home safe, bank, or professional vault. Insure it.
- Diversify — Don’t put everything in silver. Gold, stocks, or cash have roles.
For tools to track your portfolio or run numbers, check Gol;d ,Bitcoin & Crypto Profit & DCA Calculators. Also see Today Gold Rate in USA: 1 Ounce & 10 Gram Price for related precious metals data. Start at Bitfluxe Home.
Featured Snippet: Key Triggers of the 2026 Silver Crash The January 30, 2026 plunge (up to 31%) was mainly triggered by CME margin hikes on silver futures (from ~11–15% toward higher levels), forcing liquidations amid already high leverage after the $121.67 ATH. Kevin Warsh Fed nomination and dollar strength added fuel.
Featured Snippet: Silver Supply Deficit 2026 The Silver Institute projects a 67 million ounce market deficit in 2026 — the sixth consecutive year. Total supply ~1.05 billion ounces vs higher demand, especially industrial.
FAQ — Silver Price Crash 2026
Will silver recover after the 2026 crash?
Possible, thanks to ongoing deficits and industrial demand. But recovery speed depends on macro conditions. Many past crashes saw eventual rebounds for patient holders.
How low can silver go in 2026?
Bears like Kolanovic warn toward $50 if speculation fully unwinds. Support levels sit near $70 then lower $60s. No one knows exact bottom.
Is now the time to buy silver after the January crash?
It depends. At ~$75–$76 in April 2026, it looks cheaper than $121, but wait for stabilization or use DCA. Avoid if you can’t handle more drops.
What caused the silver price drop from $120+?
Primarily CME margin hikes triggering leveraged liquidations, plus shifting Fed expectations and dollar moves.
Silver price prediction 2026: $50 or $100+?
Range is wide — JPM ~$81 average, bulls higher on ratio compression, bears toward $50. Fundamentals favor upside; volatility favors caution.
Should I buy physical silver in 2026?
Only with a long horizon, after checking local premiums, storage, and taxes. It’s not quick trading money.
How does the gold silver ratio affect silver prices?
A high ratio often signals silver is relatively cheap and may outperform later. Watch for compression as a bullish sign.
Silver’s wild ride in 2026 shows one truth: this metal rarely moves quietly. The silver price crash 2026 flushed excess. The structural deficit remains real. But paper volatility can still hurt badly.
Buy smart — or sit on cash. Your call, based on the data, not emotions.
Publisher Note This analysis draws from public data including Silver Institute reports, JPMorgan forecasts, CME notices, and market price records as of April 2026. I am not a financial advisor. Precious metals involve significant risk of loss. Past performance and deficits do not guarantee future prices. Always do your own research, consider your local regulations (taxes, storage, premiums), and consult licensed professionals before investing. Prices can go to zero in extreme scenarios — never risk money you can’t afford to lose. This is for educational discussion only.

Hi, I’m Baber! I’m a blogger and crypto enthusiast dedicated to uncovering the best trading key levels in the financial markets. My mission is to break down advanced technical analysis tools into easy-to-follow guides for traders worldwide. When I’m not analyzing charts on TradingView, I’m busy researching the latest in blockchain security and SEO strategy to bring you the most accurate market updates.
View full details on our Terms and Conditions page.