DXY Dollar Index & Gold Price Correlation 2026: Complete Analysis with Live Charts
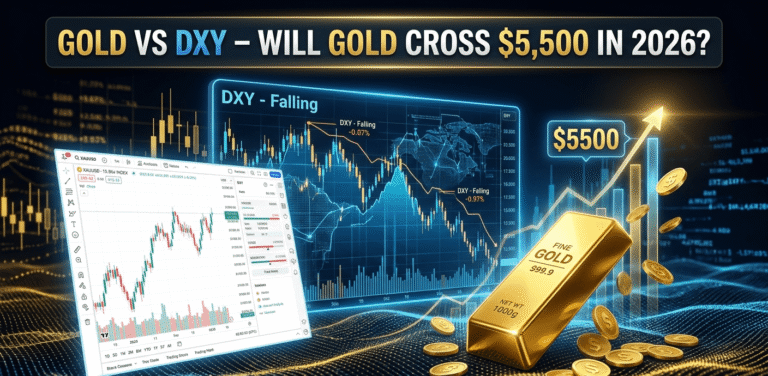
Look, the 30-day DXY-gold correlation just hit -0.25. That’s way weaker than the long-term average of around -0.45. Gold sits near $4,720–$4,730 per ounce today (April 13, 2026), while the DXY hovers around 99. Everyone keeps saying “dollar down, gold up.” But is that old rule still reliable in 2026? Or is something bigger changing? Let’s cut through the noise with real numbers and clear charts.
Why the Classic DXY-Gold Inverse Relationship Feels Unreliable Right Now
For decades, the relationship looked simple. Stronger dollar makes gold expensive for buyers outside the US, so demand drops. Weaker dollar does the opposite. That gave us a solid negative correlation.
But 2026 feels different. Gold has already spiked toward $5,700 early this year before pulling back. DXY has swung between 95 and 101. Yet the moves don’t always line up perfectly anymore. Central banks keep buying gold no matter what the dollar does. That buying adds a new floor.
According to AhaSignals data as of early April 2026, the 30-day correlation sits at -0.25. That’s a clear weakening. Historical baseline? Closer to -0.45. This shift creates confusion for traders who rely on the old inverse rule.
What the Real 2026 Correlation Numbers Are Telling Us
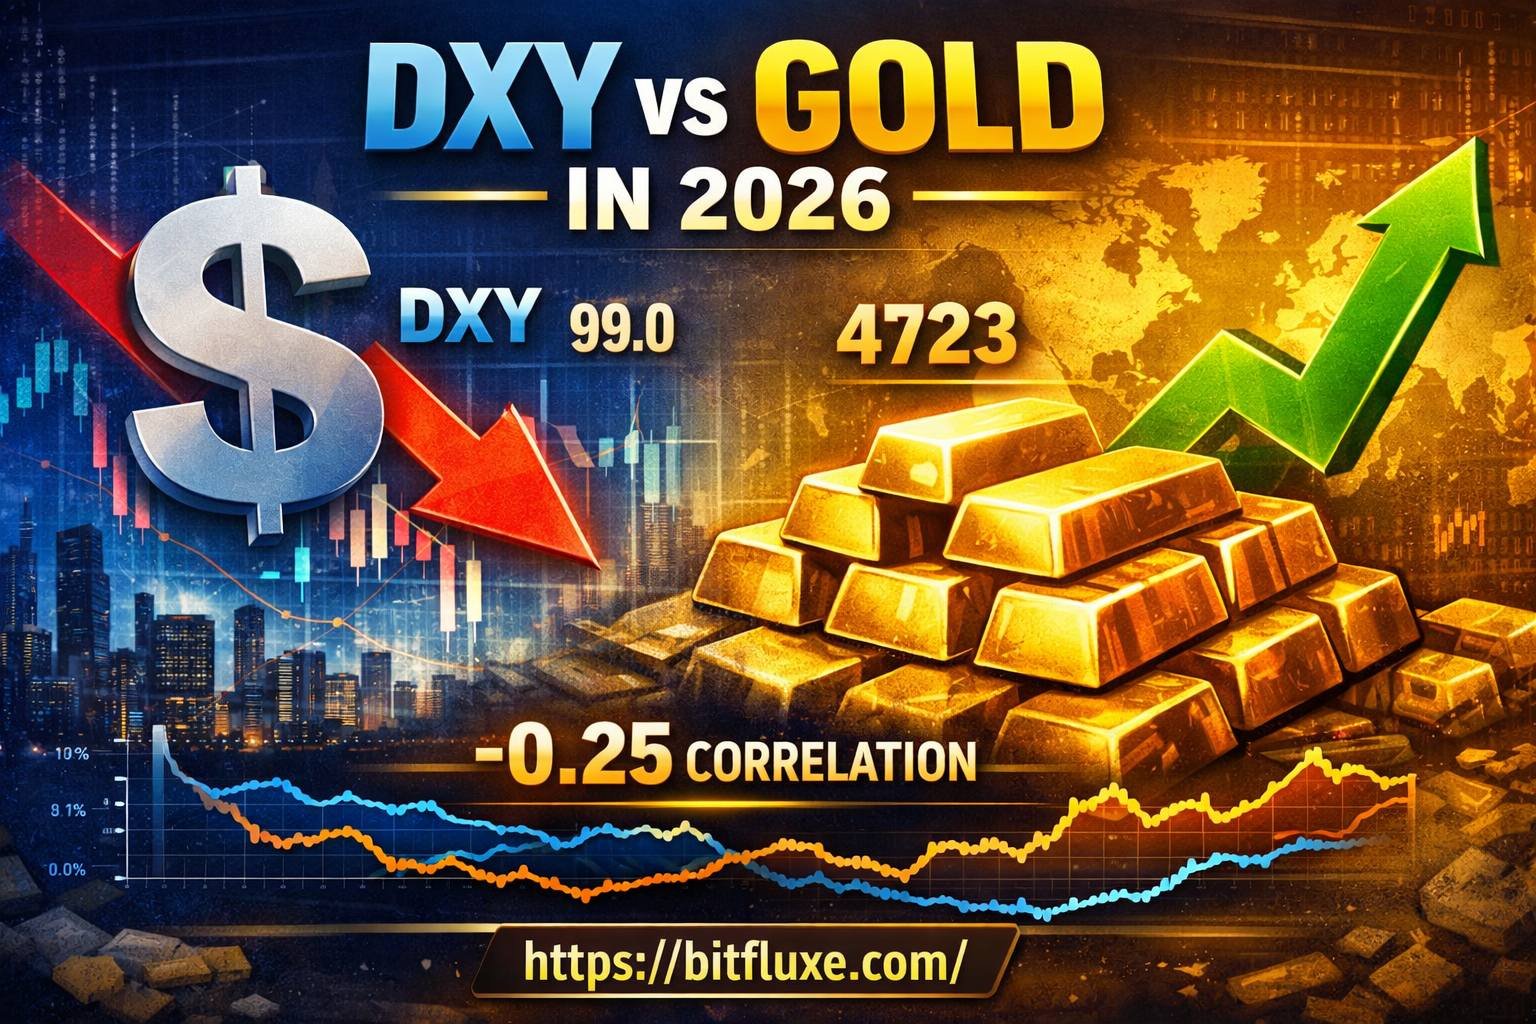
Let’s get specific with the stats. Right now in mid-April 2026, DXY trades near 99.0–99.1. Gold price hovers around $4,723 per ounce. The short-term link has loosened.
The 30-day gold DXY correlation reads -0.25. That means only about 25% of gold’s recent moves can be explained by opposite dollar moves. Compare that to the stronger historical inverse. We’re seeing more gold DXY divergence 2026 than before.
Rolling correlations show episodes where both assets moved in the same direction briefly. This isn’t total breakdown yet. But it’s enough to make the classic “DXY weakness gold rally 2026” story less automatic.
Watch the DXY live chart 2026 closely. Small bounces above 99 often pressure gold. Drops below 98 tend to support it. But central bank flows can override these signals.
DXY Weakness Gold Rally 2026 – How Strong Is the Link Today?
Dollar weakness still helps gold. No doubt there. When DXY slips, gold becomes cheaper in other currencies. That boosts demand from China, India, and elsewhere.
In 2026 so far, periods of DXY softness have fueled gold rallies. Yet the link isn’t as tight as in past decades. Why? Because central bank gold buying 2026 acts like a constant buyer of last resort.
Poland added 20 tonnes in February alone. Uzbekistan, Kazakhstan, and others keep stacking. The World Gold Council expects around 850 tonnes of net central bank purchases for the full year. That’s real structural demand that doesn’t care about short-term DXY swings.
So yes, DXY weakness remains a tailwind. But don’t expect perfect inverse moves every time.
Track These Key DXY Levels to Predict Gold Moves in 2026
Want a practical edge? Focus on these DXY zones:
- Below 98: Strong support for gold. Expect upward pressure on prices.
- 99–100: Neutral to mildly negative for gold. Watch for pauses or mild corrections.
- Above 101: Clear headwind. Gold often struggles here.
These levels have mattered in 2026 price action. A break below 97 could spark a fresh DXY weakness gold rally 2026. A push above 100 might cap gold near current levels or trigger a deeper pullback.
Check DXY technical analysis 2026 regularly. Combine it with real yield trends and Fed signals for better timing.
Central Bank Gold Buying vs Dollar Strength – The New Decoupling Force
Here’s the big shift in 2026: central banks treat gold as a diversification tool against the dollar. This creates a de-dollarization effect on gold.
Even when DXY strengthens temporarily, many emerging market central banks keep buying. China has added gold steadily. Poland and others in Europe joined in. This buying reduces the power of traditional dollar strength to crush gold prices.
The result? A partial decoupling. The old inverse isn’t dead, but it’s less dominant. Gold DXY divergence happens more often because of this price-insensitive demand.
Can Gold and the Dollar Rise Together in 2026? (The Contrarian Reality)
Yes, it has happened — and it matters.
In certain risk-off periods, both gold and the dollar can attract safe-haven flows at the same time. We’ve seen brief positive or near-zero correlations in 2026. Geopolitical spikes or sudden liquidity crunches can drive this.
Don’t dismiss these moments. They prove the relationship isn’t ironclad. When both rise together, it often signals extreme uncertainty where traditional rules bend. Smart traders use these divergences as warning signs rather than fighting them.
Real Yields, Fed Rate Cuts & Their Direct Impact on DXY-Gold Relationship
Real yields remain a key driver. Lower real yields make non-yielding gold more attractive. Expected Fed rate cuts in 2026 tend to weaken the DXY and support gold.
But timing matters. If the Fed cuts slower than markets price in, DXY can firm up and pressure gold temporarily. We’ve seen this play out in early 2026 volatility.
The real yields gold relationship has also shown some inversion at times. Gold rose even as yields ticked higher in certain windows — another sign of strong structural demand overriding classic drivers.
Live Chart Deep Dive: DXY vs Gold Price Action in 2026 So Far
Imagine the chart: Gold surged hard early 2026, testing $5,700 before correcting back toward $4,700. DXY meanwhile swung in a 95–101 range.
Key divergence moments:
- When DXY dropped sharply, gold didn’t always explode higher immediately.
- Central bank announcements often provided support even during DXY bounces.
The DXY live chart 2026 overlaid with gold shows the weakened correlation clearly. The lines don’t mirror each other as tightly as in 2020–2024. Rolling 30-day correlation lines confirm the -0.25 zone.
This “live” picture tells us: respect the inverse, but prepare for exceptions.
Gold Price Scenarios for 2026 Tied Directly to DXY Moves
Let’s map realistic paths:
Base case (DXY stays 97–100): Gold averages $5,000–$5,400. Central bank buying + moderate dollar weakness provide steady support.
Bull case (DXY weakens toward 95–96 on aggressive Fed cuts): Gold pushes $5,800–$6,300. JPMorgan and others see this range possible with strong diversification flows.
Bear case (DXY strengthens above 101 on resilient US data): Gold corrects toward $4,200–$4,500 but finds a higher floor thanks to official buying.
Most forecasts lean bullish. JPMorgan targets around $5,000–$6,300 by year-end depending on dollar and policy paths.
Trading & Hedging Strategies That Actually Work When Correlation Weakens
Don’t bet everything on perfect inverse moves. Here’s what works better in 2026:
- Use DXY levels as filters, not triggers. Confirm with volume and central bank news.
- Hedge with gold when DXY shows weakness signals, but keep position sizes smaller during low-correlation periods.
- Diversify across physical gold, miners, or related assets for global exposure.
For emerging market investors (Pakistan, India, etc.), local currency strength against USD adds extra layers — track both DXY and your home currency.
Check real-time tools here for better timing → Bitcoin & Crypto Profit & DCA Calculators
How to Position for the New DXY-Gold Regime
Global investors should treat gold as a core diversifier, not just a dollar trade.
Aim for 5–15% allocation depending on risk tolerance. US investors: use it against equity and bond correlation risks. International investors: it hedges both dollar strength and local inflation.
Rebalance when DXY hits key levels. Add on dips supported by central bank flows. Reduce if DXY breaks higher sustainably.
The new regime rewards patience over aggressive inverse bets.
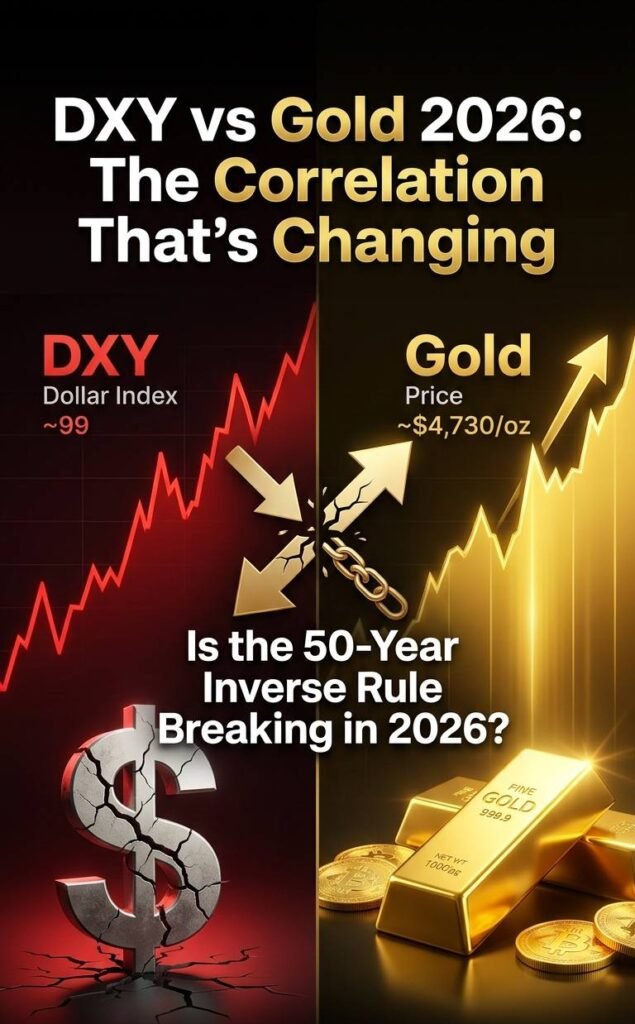
2026 Endgame: Will the DXY-Gold Correlation Revert or Stay Broken?
Look, the classic inverse isn’t gone. It still influences moves. But central bank gold buying 2026, de-dollarization trends, and shifting safe-haven dynamics make it less reliable.
I expect partial reversion if Fed policy normalizes and geopolitical risks ease. Yet the floor for gold looks structurally higher. Don’t count on the old -0.45 correlation returning fully.
The smarter play: monitor 30 day gold DXY correlation monthly. Adjust as the regime evolves.
Featured Snippet: Current 2026 Stats As of mid-April 2026: • DXY ≈ 99.0–99.1 • Gold ≈ $4,723/oz • 30-day correlation ≈ -0.25 (vs historical -0.45) Weaker link, but dollar weakness remains a net positive tailwind for gold.
Featured Snippet: Key Actionable Levels Watch DXY below 98 for gold upside acceleration. Above 101 for downside pressure. Combine with Fed signals and central bank purchase data for best results.
FAQ
What is the current correlation between DXY and gold in 2026?
The 30-day correlation stands around -0.25, weaker than the long-term average of -0.45.
Does a weaker DXY still push gold higher this year?
Yes, it remains a tailwind, but central bank buying and other factors can reduce the impact.
Can gold and the dollar rise together in 2026?
Yes, brief periods happen during extreme risk-off or safe-haven flows.
How will Fed policy affect DXY and gold prices?
Rate cuts generally weaken DXY and support gold via lower real yields.
What is the gold price forecast for 2026 if DXY stays weak?
Analysts see $5,000–$6,300 possible, with central bank demand providing strong support.
Why has the DXY-gold inverse relationship weakened recently?
Structural central bank buying, de-dollarization, and occasional dual safe-haven demand override the classic dynamic.
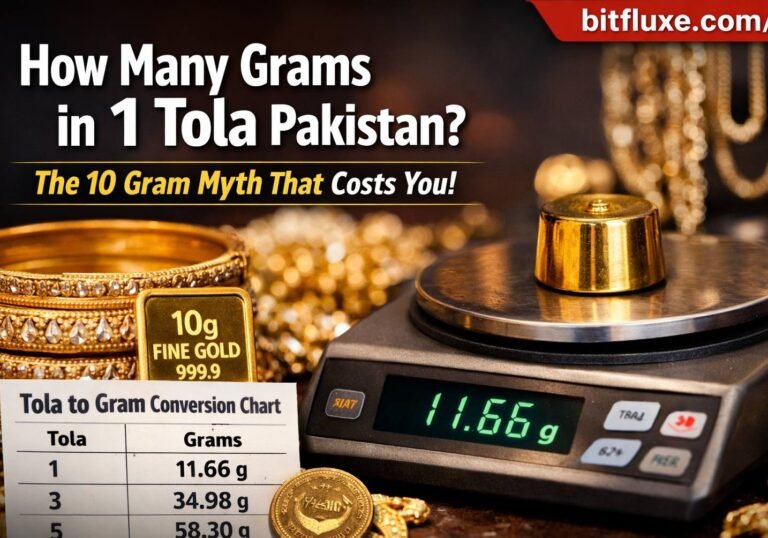
Where to check today gold rate in USA?
Today Gold Rate in USA: 1 Ounce & 10 Gram Price
I’ve followed gold and currency markets for years through multiple cycles. The 2026 shifts feel real — stronger structural demand is changing old rules. Always do your own research and consider professional advice. Markets can surprise.
For more tools and updates, visit Bitfluxe Home.

Hi, I’m Baber! I’m a blogger and crypto enthusiast dedicated to uncovering the best trading key levels in the financial markets. My mission is to break down advanced technical analysis tools into easy-to-follow guides for traders worldwide. When I’m not analyzing charts on TradingView, I’m busy researching the latest in blockchain security and SEO strategy to bring you the most accurate market updates.
View full details on our Terms and Conditions page.