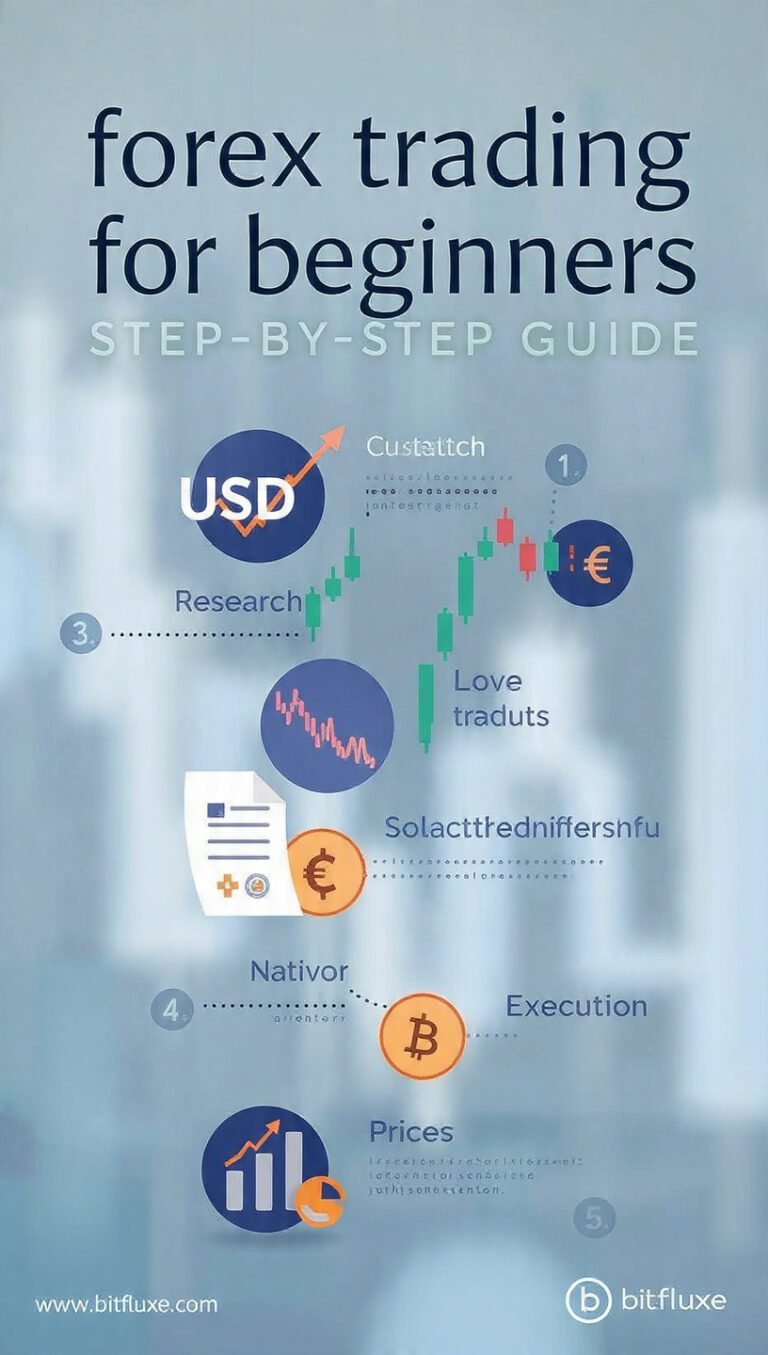
Understanding how to read crypto and forex charts is the first step toward profitable trading. Charts reveal hidden patterns, showing Bullish and Bearish Sentiments and exposing moments of Price Consolidation before major moves.
By mastering Technical Analysis Tools, traders can spot Breakout and Breakdown points, visualize market trends, and plan entries with confidence. Even beginners can benefit by observing Swing Highs and Swing Lows, interpreting historical price action, and tracking Market Momentum to anticipate potential reversals. Learning to read charts systematically turns guesswork into informed decisions. With consistent practice, chart analysis becomes a reliable guide for navigating volatile global trading markets effectively.
The Basics: Understanding Price Action in Crypto and Forex
At its core, reading charts begins with price action. Price moves because buyers and sellers compete. In crypto markets, Asset Volatility is high, while in forex, liquidity often smooths movement. Both markets reflect supply and demand in real time. Through interpreting historical price data, traders estimate probabilities rather than certainties.
Key Differences: Crypto vs. Forex
Feature
Crypto
Forex
Trading Hours
24/7
24 hours, 5 days
Volatility
Very High
Moderate
Liquidity
Varies by exchange
Extremely Deep
Regulation
Developing
Mature
Line Charts vs. Candlestick Charts: Which One Should You Use?
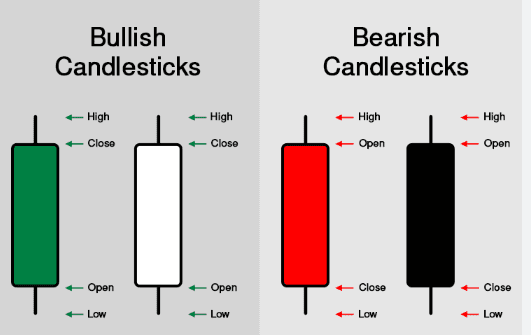
Line charts show only closing prices and look clean, but they hide vital details. Candlestick charts show the Open, High, Low, and Close (OHLC). This extra information is crucial for successful chart reading.
Candlesticks expose Bullish and Bearish Sentiments instantly. They show rejection, strength, or hesitation. When traders study patterns, they rely on candles because they support executing trades based on objective evidence rather than guesswork.
How to Read a Candlestick: Open, Close, High, and Low (OHLC)
Each candle has four data points:
Open: Where price started.
Close: Where it ended.
High & Low: The price extremes during that period.
A long green body shows strength, while a long upper wick shows rejection. Understanding OHLC allows traders to spot Breakout and Breakdown attempts and clarifies Market Momentum shifts.
Setting Up Your Workspace: Using TradingView
Most global traders use TradingView because it offers powerful tools and a clean design. It provides advanced drawing tools and indicators. Many beginners rely on structured TradingView Tutorials to accelerate their learning curve.
A clean workspace reduces noise. Traders should add moving averages and RSI carefully to identify confluence between multiple indicators, which increases the probability of success.
Timeframes Explained: Scalping vs. Swing Trading
Short-term traders use Chart Timeframes (1h, 4h, Daily) differently.
Scalpers: Focus on 1m to 15m charts.
Swing Traders: Analyze 4h and Daily charts.
Investors: Review Weekly or Monthly trends.
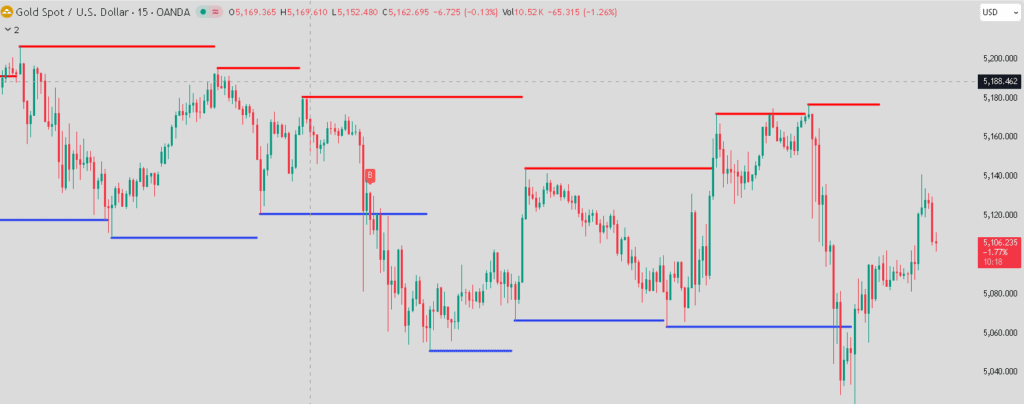
Analysis becomes stronger when you align timeframes. If the daily chart trends upward and the 4h shows pullback support, your probability improves. This supports dynamic support and resistance mapping.
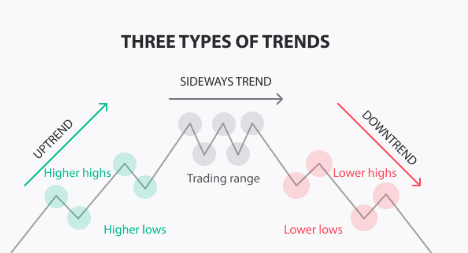
Identifying Market Trends: Uptrends, Downtrends, and Sideways
Trends form when price creates Higher Highs (HH) and Higher Lows (HL).
Uptrend: Price moves up consistently.
Downtrend: Price creates Lower Highs and Lower Lows.
Sideways: Price stays in a tight range (Price Consolidation).
Recognizing the trend type early protects your capital. Strong trends usually align with high volume, while weak trends fade quickly.
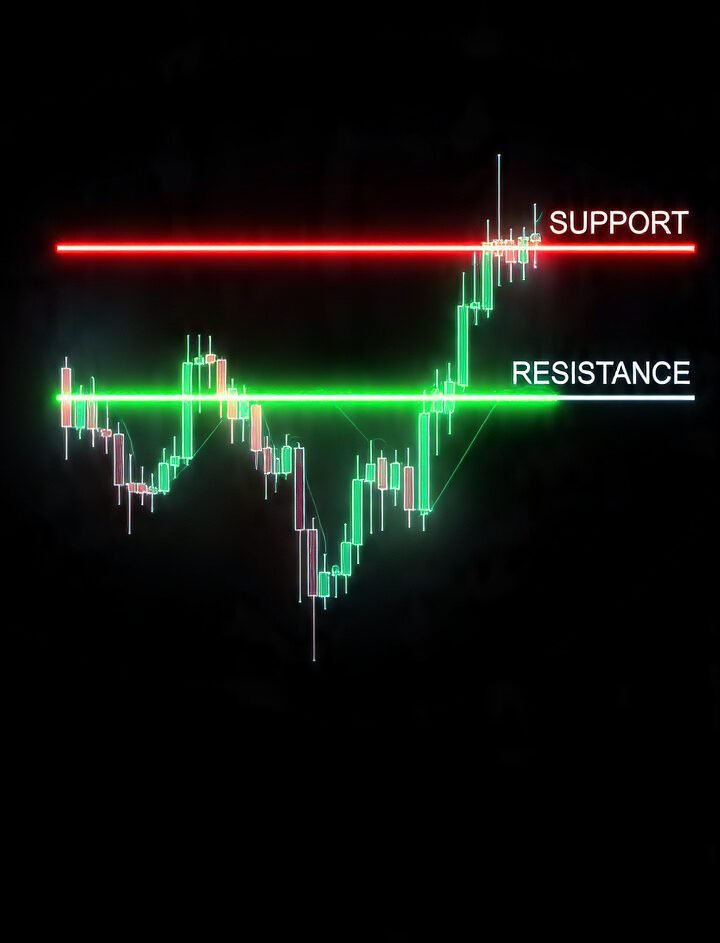
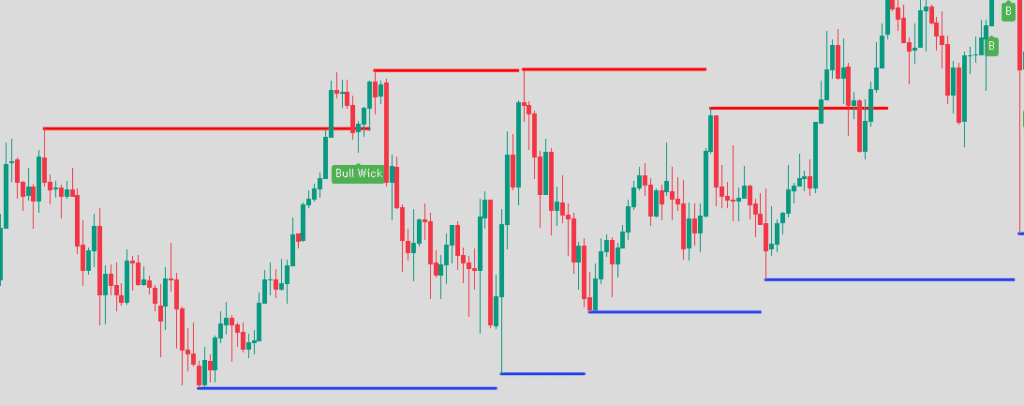
The Power of Support and Resistance Levels
Support is where buyers step in, and Resistance is where sellers dominate. These often align with psychological levels (e.g., $50,000 for Bitcoin). Professional traders focus on mapping institutional supply and demand zones.
Level Type
Role
Support
Potential buying area (Floor)
Resistance
Potential selling area (Ceiling)
Breakout
Price breaks above Resistance
Breakdown
Price breaks below Support
Top Technical Indicators for Beginners
Indicators simplify analysis, but they should be used in moderation.
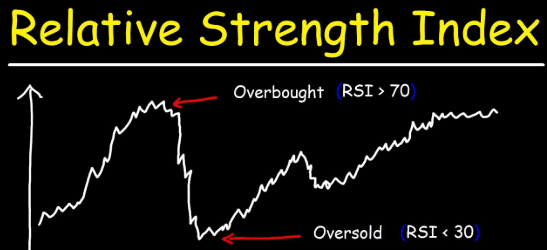
1. Relative Strength Index (RSI)
RSI highlights Overbought and Oversold regions. Use this formula for deep understanding:
Moving averages smooth out price data to show the trend direction clearly.
3. MACD
Tracks Market Momentum shifts and potential trend reversals.
“5 Steps to Analyze Any Chart in 2 Minutes”
Identify the Trend: Check the Daily timeframe first.
Mark Levels: Draw key Support and Resistance zones.
Spot Patterns: Look for Hammer or Engulfing candles.
Check RSI: Is the asset overbought or oversold?
Confirm with Volume: Is there enough strength behind the move?
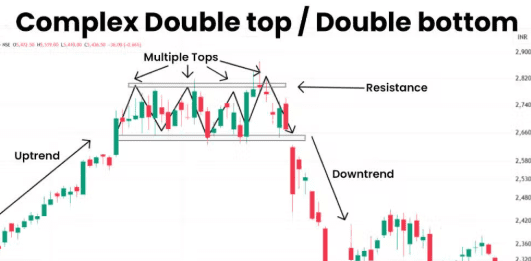
Case Study: In early 2024, Bitcoin showed a ‘Double Bottom’ pattern on the daily chart near $40,000, which was a clear signal for a massive bullish breakout.
Common Mistakes to Avoid
Beginners often overtrade and chase every green candle. Avoid:
Emotional reactions: Don’t trade out of fear (FOMO).
Indicator overload: Don’t put 10 indicators on one chart.
Ignoring Volume: A move without volume is often a “fakeout.”
Disclaimer: Trading involves significant risk. The information in this article is for educational purposes only and not financial advice. Past performance does not guarantee future results. Always consult a professional before investing.
FAQ
1. What is the best chart type for beginners to use? Candlestick charts are best for beginners right now. They clearly show open, high, low, and close prices in one view. This helps you understand market mood fast. Line charts look simple, but they hide detail. Candlesticks reveal momentum, reversals, and breakout strength clearly.
2. Do crypto and forex charts work the same way? Yes, both follow the same price action principles. Support, resistance, trends, and patterns behave similarly. However, crypto runs 24/7 and shows higher volatility. Forex closes on weekends and often has deeper liquidity. The structure is the same, but volatility levels differ.
3. What is a “Timeframe” and which one is best for day trading? A timeframe shows how long each candle represents. For example, 1-hour or 4-hour charts. For day trading, most traders prefer 15-minute or 1-hour charts. These offer balance between detail and clarity. Shorter charts move fast but create more noise.
4. How do I know if a trend is about to reverse? Look for slowing momentum, divergence on RSI, and reversal candlestick patterns like engulfing or hammer. Volume spikes during exhaustion also help. Lower highs in an uptrend often warn early. No signal is perfect, but combining tools improves probability.
5. What is the difference between a support level and a resistance level? Support is a price zone where buyers step in and stop price from falling further. Resistance is where sellers push price down. Think of support as a floor and resistance as a ceiling. When broken, they often switch roles.
6. Can I read charts on my mobile phone, or do I need a laptop? You can read charts on your phone using apps like TradingView. However, a laptop offers better visibility and drawing precision. For serious analysis, bigger screens reduce mistakes. Mobile works for monitoring trades on the go.
7. What does a “Doji” candlestick signify in a chart? A Doji shows indecision. The open and close prices are nearly equal. Buyers and sellers fought, but neither won. When it appears at key support or resistance, it may signal a possible reversal.
8. How many technical indicators should a beginner use? Two or three indicators are enough. For example, RSI, moving averages, and volume. Too many indicators create confusion and mixed signals. Focus on clarity, not complexity.
9. Is technical analysis 100% accurate? No, technical analysis is never 100% accurate. It works on probability, not certainty. Even strong setups can fail. Risk management matters more than prediction.
10. What is the RSI indicator and how does it help in chart reading? RSI stands for Relative Strength Index. It measures momentum and shows overbought or oversold areas. Values above 70 suggest overbought conditions. Below 30 suggests oversold. It helps time entries and exits better.
11. How do I identify a “fakeout” on a price chart? A fakeout happens when price breaks support or resistance but quickly reverses back. Low volume during breakout is a warning sign. Waiting for candle close confirmation reduces fakeout risk.
12. Why is volume important when analyzing crypto charts? Volume shows participation strength. High volume confirms real breakouts. Low volume suggests weak moves. In crypto, volume helps confirm trend strength because markets run nonstop.
13. What is the most popular charting software for traders? TradingView is currently the most popular platform. It offers advanced tools, indicators, and easy access on web and mobile. Many U.S. traders prefer it.
Hi, I’mBaber! I’m a blogger and crypto enthusiast dedicated to uncovering the best trading key levels in the financial markets. My mission is to break down advanced technical analysis tools into easy-to-follow guides for traders worldwide. When I’m not analyzing charts on TradingView, I’m busy researching the latest in blockchain security and SEO strategy to bring you the most accurate market updates.
Financial Disclaimer: Trading cryptocurrencies and gold involves significant risk. The tools, calculators, and forecasts on BitFluxe.com are for educational purposes only and do not constitute financial advice. Always conduct your own research or consult a professional before making investment decisions.
View full details on our Terms and Conditions page.
Understanding the nuances of the Gold Price Prediction in Pakistan Tomorrow: Technical Analysis for 2026 is essential for any savvy investor navigating today’s volatile market. As local bullion rates remain deeply interconnected with global shifts, discerning the right time to buy or sell requires a disciplined approach to reading charts. By evaluating key support and…
Forex trading has become one of the most accessible ways for Americans to enter the global financial world. Every day, trillions of dollars move through the currency market, creating endless opportunities driven by exchange rate movement. If you’ve ever wondered how people profit from buying and selling currencies online, this guide will simplify everything. Success…
Gold buyers often wonder about the 24K vs 22K Gold Price Difference Today before investing or buying jewelry. The difference goes beyond price. It involves purity, durability, craftsmanship costs, and long-term resale potential. Understanding these factors helps you make a smarter purchase decision. Many global investors monitor gold because it protects wealth during economic uncertainty….
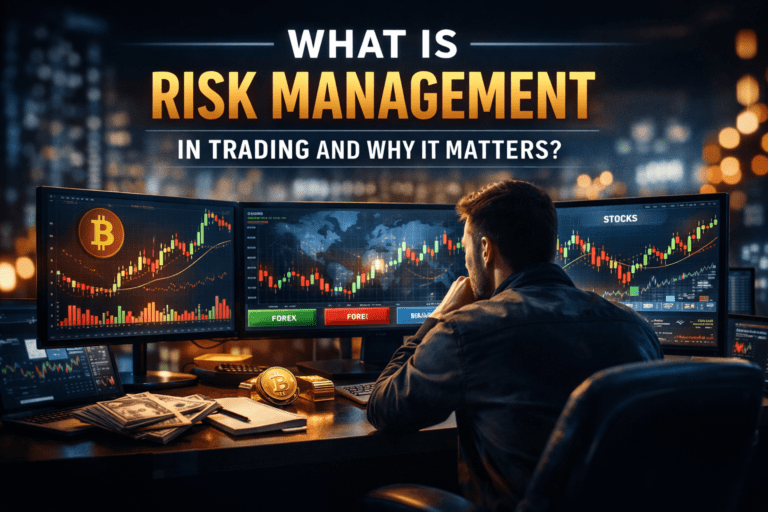
Risk management in trading determines whether you survive the markets or slowly bleed capital. Many traders in the United States ,Pakistan ,india and other countries chase profits yet ignore protection, which leads to deep Drawdown and emotional decisions. Strong risk management in trading focuses on Preserving Trading Capital before seeking returns. Markets shift through unpredictable Volatility, sudden news events, and…
I noticed something interesting in 2026 — while most crypto investors expected Bitcoin to dominate, gold quietly started beating it. This shift surprised many traders, including me. The global financial landscape is shifting, making the Bitcoin VS Gold Investment 2026 debate more critical than ever for serious investors. While physical bullion remains the traditional anchor…
If You try to send $50 worth of ETH… …and the network asks for $27 in fees. At that moment, most people think one thing: Something’s wrong. But nothing is broken. That’s just how Ethereum works—and if you don’t understand it, you’ll keep losing money without realizing why. Here’s the part nobody tells beginners: Gas…