Gold Price Analysis at $5,000: Global Analysis: 2026
the global financial landscape is facing a historic crossroads as the yellow metal tests the unprecedented $5,000 threshold. This Gold Price Analysis at $5,000: Buying the Historic Breakout or Fearing a Psychological Crash? explores whether the current rally is sustainable or a looming bull trap.
With the Federal Reserve navigating a complex “hawkish hold” and inflation hedge demand peaking due to geopolitical instability, American investors are questioning their next move. Whether you are tracking the DXY (US Dollar Index) or monitoring safe-haven asset flows, understanding this resistance level is vital. For US-based portfolios, the choice between physical bullion and digital alternatives has never been more critical.
The $5,000 Psychological Barrier: More Than Just a Number for US Investors
In technical analysis, $5,000 is what we call a “Round Number Bias.” Human psychology tends to treat whole numbers as major hurdles. For years, the Comex futures market has used the $5,000 level as a long-term target, and now that we are here, we are seeing a massive tug-of-war between institutional accumulation and retail profit-taking.
Understanding “Round Number Bias” in the Gold Market
When an asset hits a massive milestone like $5,000, it triggers a flood of automated sell orders. Many US-based retirees who bought gold at $2,000 are now seeing 150% gains and are tempted to liquidate. This creates a “supply overhang” that can cause a false breakout, where the price briefly touches $5,050 before crashing back down to test support levels near $4,700.
Institutional vs. Retail Behavior at Key Resistance Levels
While retail investors often panic-sell at these levels, central banks (specifically the “Global South” and BRICS nations) are continuing to buy. However, for a US investor, the focus is on the Federal Reserve. If the Fed hints at “higher for longer” interest rates during today’s FOMC meeting, the opportunity cost of holding non-yielding gold increases. This shift in market sentiment is why many are asking Why gold is outperforming bitcoin in 2026, as traditional safety often trumps speculative digital plays during hawkish Fed cycles.
The Fundamental Drivers Pushing Gold to $5,000 in 2026
The surge to $5,000 didn’t happen in a vacuum. A “perfect storm” of economic indicators has converged to push the safe-haven asset to these heights. From the IRS reporting changes to the massive fiscal deficits in Washington, the case for gold has never been more fundamentally sound.
The Federal Reserve’s Dilemma: Inflation vs. Recession Fears
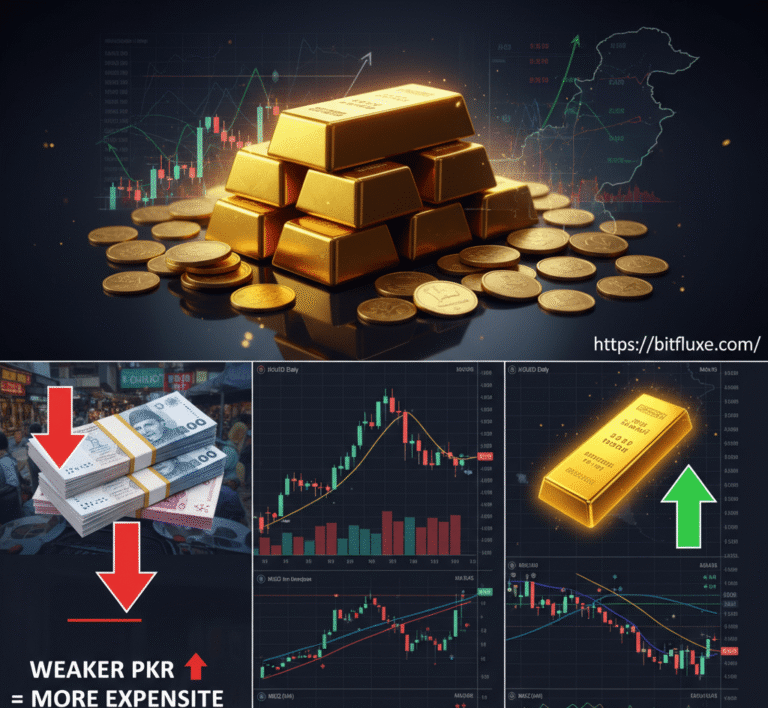
The Fed is currently trapped. Inflation (CPI) remains sticky near 3%, yet the labor market is showing cracks. US investors are flocking to gold because it acts as the ultimate inflation hedge. When the “Real Yield” on 10-year Treasuries turns negative, gold naturally shines. If you are trying to manage different denominations of your holdings, our Gold Unit Converter can help you quickly translate ounces into grams or kilograms for better portfolio tracking.

Comparison Table: Gold vs. Major Assets (March 2026 YTD)
| Asset Class | Year-to-Date Return | Primary Driver |
| Spot Gold (XAU/USD) | +34.8% | Geopolitical Risk & Inflation |
| S&P 500 | +33.1% | AI Tech Earnings & Low Volatility |
| Bitcoin (BTC) | +153.1% | Institutional ETF Adoption |
| US Dollar (DXY) | -4.2% | De-dollarization & Rate Cut Bets |
Technical Analysis: Confirming the $5,000 Breakout
To confirm if the current price is a bullish consolidation or a top, we must look at the technical indicators. Currently, the Relative Strength Index (RSI) is hovering near 75, suggesting the market is slightly overbought on the daily chart.
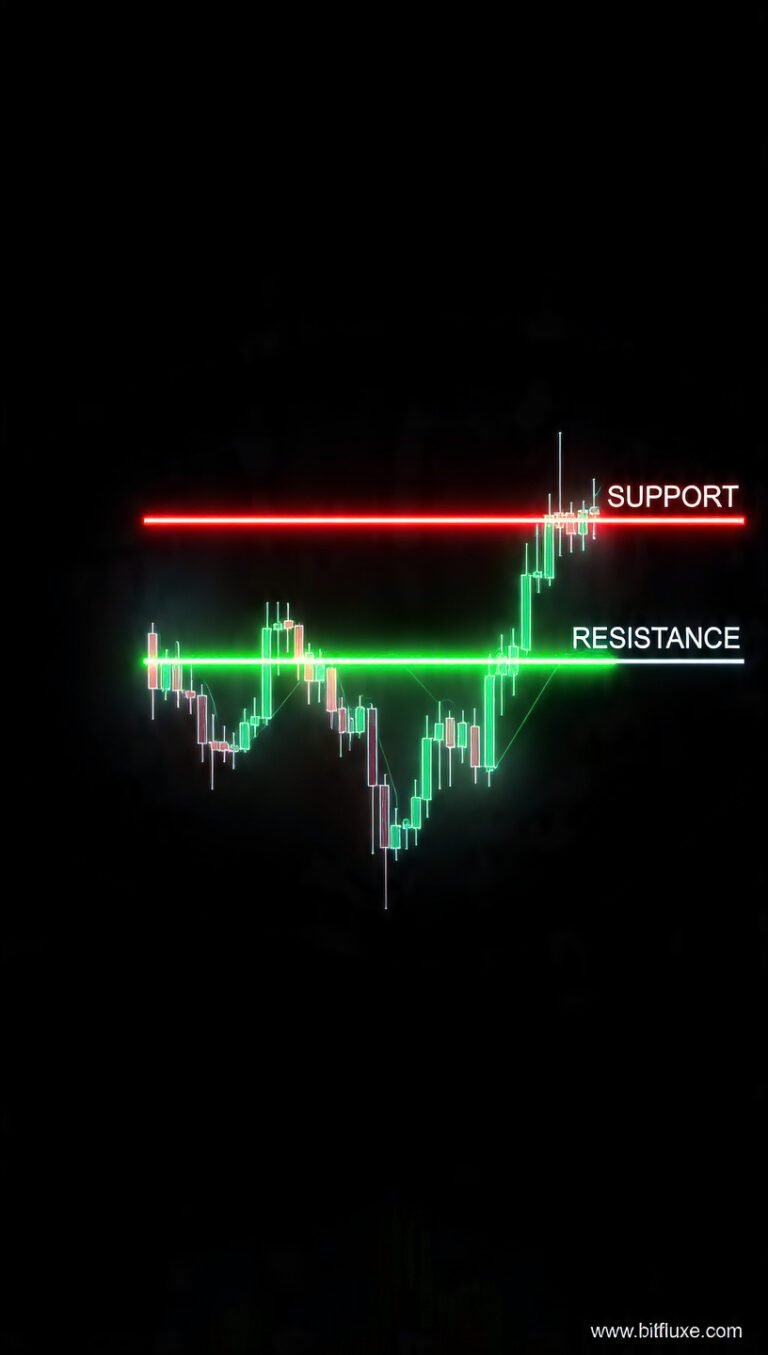
Key Support Levels to Watch
If gold fails to hold above $5,000 on a weekly closing basis, we expect a retest of the 100-day SMA (Simple Moving Average) at **$4,555**. This would be a “healthy retracement” in a broader bull market. However, if gold stays above $5,000 for three consecutive sessions, the next resistance level is the Fibonacci extension at **$5,260**.
Pro-Tip: The “False Breakout” Trap
Pro-Tip: Never buy the first time a major psychological level is hit. Institutional “whales” often push the price slightly above $5,000 to trigger stop-loss orders. Wait for a retest and bounce from the $5,000 level before going all-in.
Actionable Strategy for US Investors at $5,000 Gold
Investing at “all-time highs” requires a disciplined approach, especially with the IRS keeping a close eye on precious metal gains.
Physical Bullion vs. Gold ETFs (GLD, IAU)
For US residents, Physical Gold is often taxed as a “collectible” with a maximum long-term capital gains rate of 28%.
- Pro: Physical gold is “off the grid” and satisfies US vaulting standards.
- Con: Selling physical gold involves high bid-ask spreads.
FAQ: Everything Americans Need to Know About Gold at $5,000
Q: Is gold still a good hedge against inflation at $5,000?
A: Yes. Historically, gold has maintained its value over decades. While the nominal price is high, the “inflation-adjusted” price shows gold is still within a reasonable valuation range.
Q: Will the US Dollar’s strength crash the gold price?
A: Usually, a strong DXY hurts gold. However, in 2026, we are seeing a “decoupling” where both can rise during extreme global uncertainty.
Conclusion: The New Era of Gold — A Permanent Shield or a Temporary Peak?
Gold at $5,000 marks the beginning of a new economic era. Whether it’s a result of de-dollarization or a hedge against a potential recession, the yellow metal has proven its resilience. For the American investor, the strategy should not be “timing the top,” but rather asset allocation.
If you haven’t balanced your portfolio yet, our Wealth Simulator can help you visualize how a 5-10% gold allocation can protect you during market crashes. Don’t let the $5,000 price tag scare you—focus on the purchasing power you are trying to preserve.

Hi, I’mBaber! I’m a blogger and crypto enthusiast dedicated to uncovering the best trading key levels in the financial markets. My mission is to break down advanced technical analysis tools into easy-to-follow guides for traders worldwide. When I’m not analyzing charts on TradingView, I’m busy researching the latest in blockchain security and SEO strategy to bring you the most accurate market updates.
View full details on our Terms and Conditions page.